Changing things up with ggplot2 themes
Are you tired of adding your favorite ggplot2 theme to every data visualization you create in R? Then I have a solution for you!
Before you start to create any plots call the theme_set() function with your favorite theme as first argument, e.g.
library(ggplot2)
theme_set(theme_minimal())
That will ensure all plots you subsequently create will use this theme unless you add a different one.
data("mtcars")
ggplot(mtcars, aes(hp, mpg, color = wt)) +
  geom_point()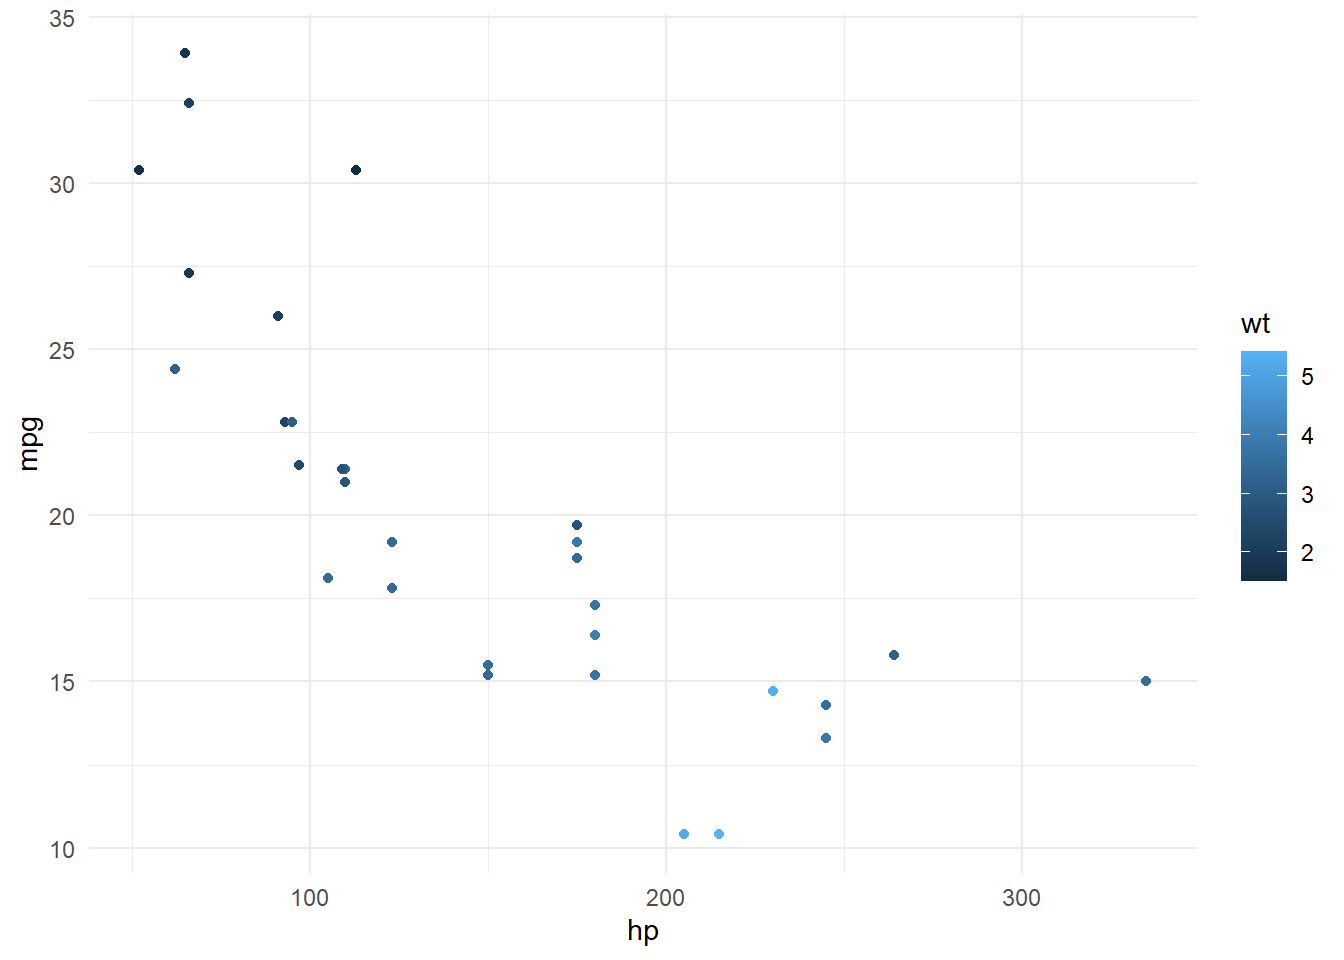
Very handy for lazy people like me.