Turning your ggplot2 code into a function
If you find yourself repeatedly writing the same ggplot2 code to create a data visualization in R, then it’s time to put your code into a function.
You may start out with an implementation similar to this one.
library(ggplot2)
theme_set(ggcharts::theme_hermit(grid = "XY"))
data("mtcars")

scatter_plot <- function(data, x, y) {
  ggplot(data, aes(x, y)) +
    geom_point(color = "yellow")
}
That won’t work though.
scatter_plot(mtcars, hp, mpg)## Error in FUN(X[[i]], ...): object 'hp' not found
If you call this function, R will look for a variable called hp rather than looking for a column with that name inside the data frame you passed as the first argument.
So, maybe it works when putting the column names in quotes?
scatter_plot(mtcars, "hp", "mpg")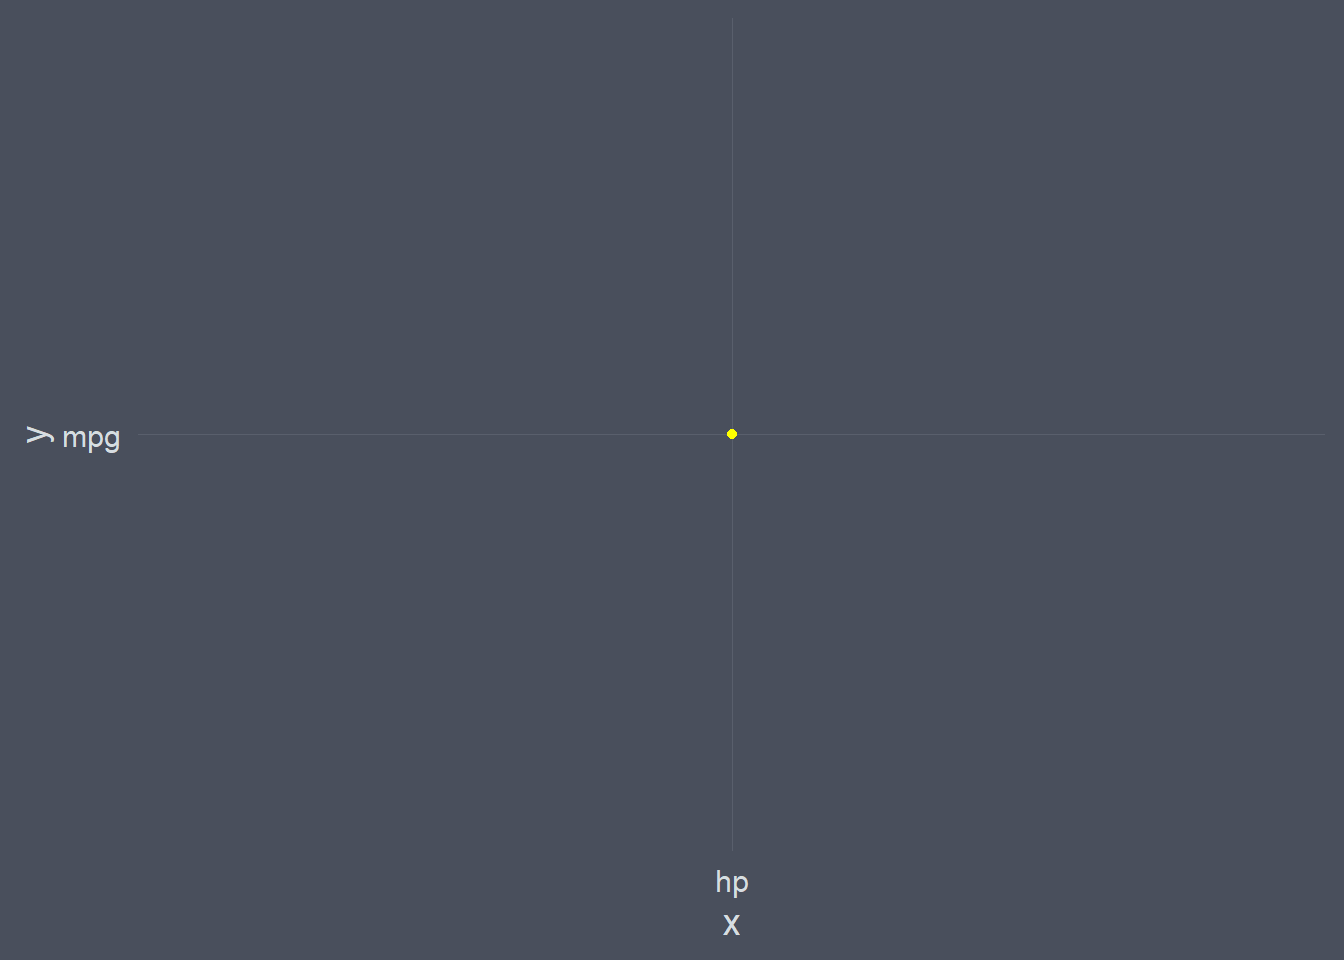
Well, no error this time but that most likely did not produce what you expected.

The key to making this work is to tell R somehow that it should look for the x and y arguments inside data. How can you achieve this? Using {{ }} (speak curly-curly) from the rlang package.
scatter_plot2 <- function(data, x, y) {
  ggplot(data, aes({{x}}, {{y}})) +
    geom_point(color = "yellow")
}
scatter_plot2(mtcars, hp, mpg)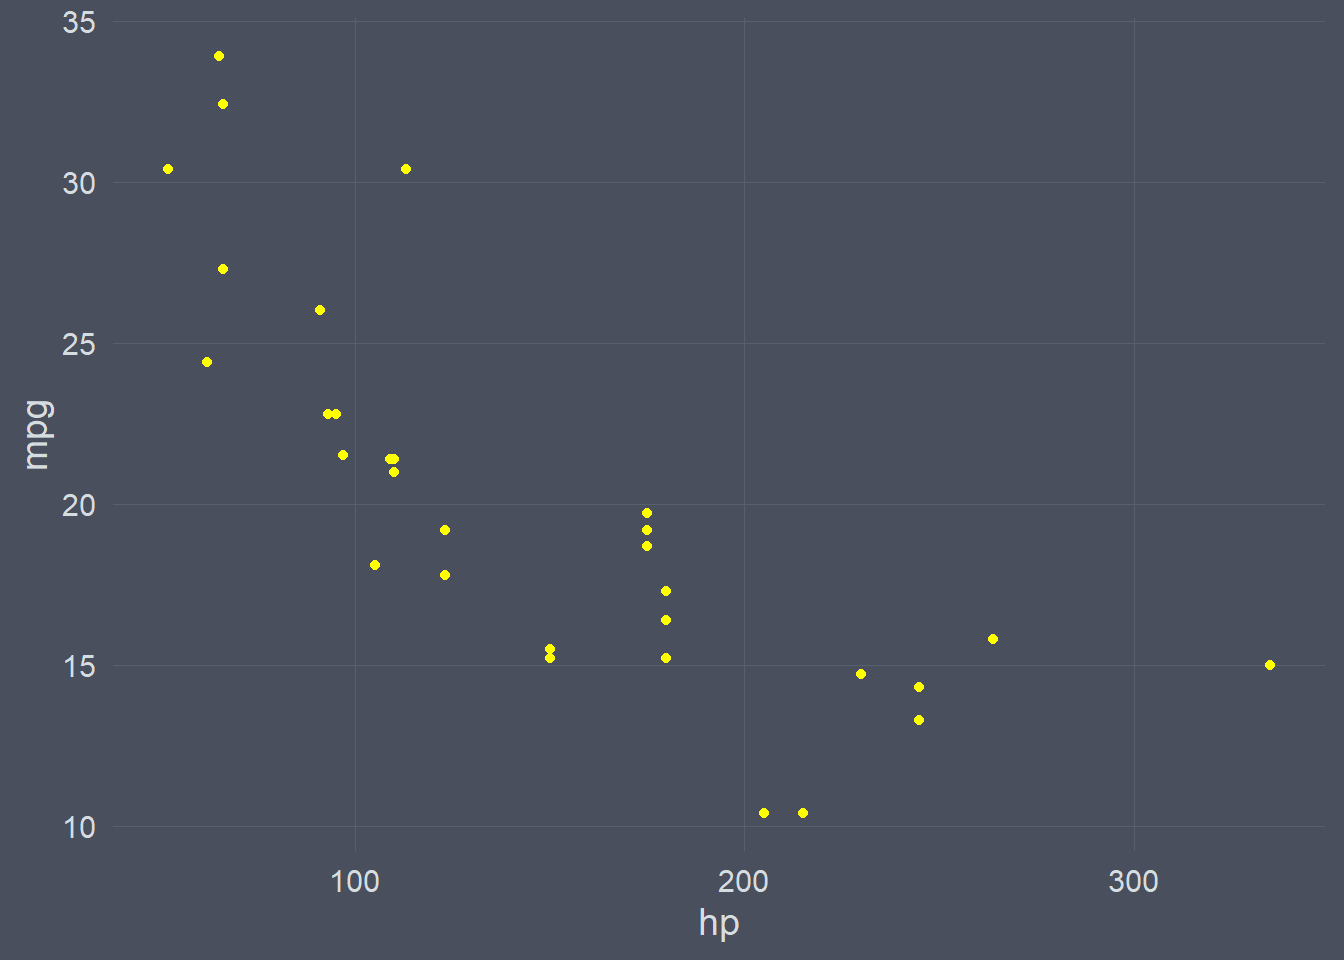
There you have it: that’s how you can create your own custom plotting function on top of ggplot2.
Want to see the power of custom plotting functions in action? Make sure to check out my ggcharts package.