Enhance Your {ggplot2} Data Visualizations with {ggtext}
I am super exciting to share with you my recent “discovery” of the {ggtext} R package.
I had looked for a solution to color individual words in the title of a {ggplot2} data visualization and {ggtext} provided me with a great solution for doing just that (and more).
So, how does it work? Have a look at this example.
library(ggplot2)
library(dplyr)
data(biomedicalrevenue, package = "ggcharts")

plot <- biomedicalrevenue %>%
  filter(company %in% c("Roche", "Novartis")) %>%
  ggplot(aes(year, revenue, color = company)) +
  geom_line(size = 1.2) +
  ggtitle(
    paste0(
      "<span style = 'color:#93C1DE'>**Roche**</span>",
      " *overtook* <span style = 'color:darkorange'>**Novartis**</span>",
      " in 2016"
    )
  ) +
  scale_color_manual(
    values = c("Roche" = "#93C1DE", "Novartis" = "darkorange"),
    guide = "none"
  ) +
  ggcharts::theme_hermit(ticks = "x", grid = "X")  +
  theme(plot.title = ggtext::element_markdown())
plot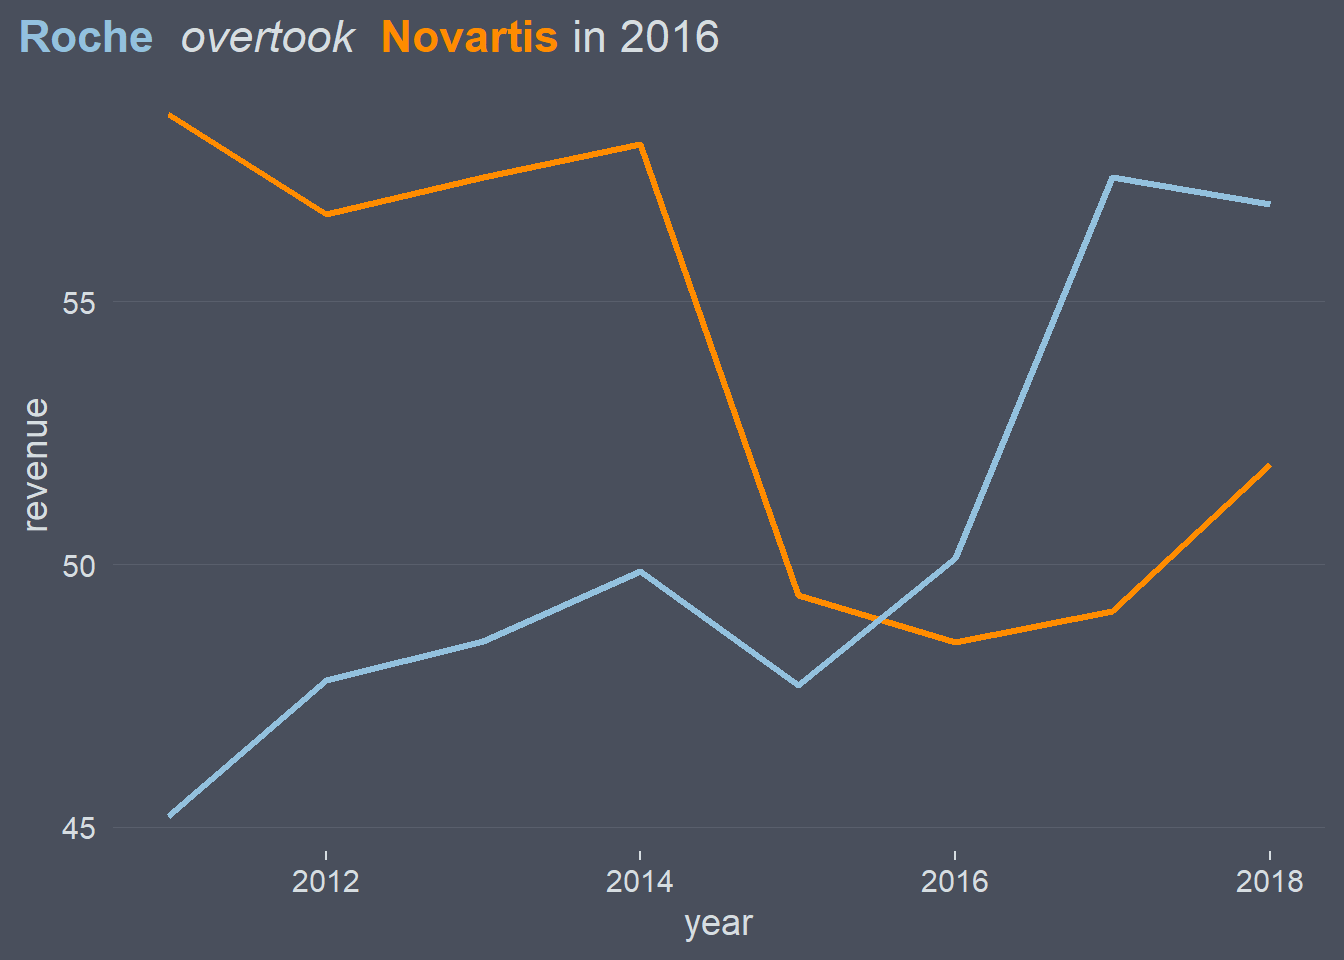
Inside theme() I set plot.title = ggtext::element_markdown(). This has the effect that the plot title I created using ggtitle() is interpreted as markdown/HTML. That made it possible to have the title of the plot act as a legend by coloring the appropriate keywords.
To color words you have to wrap them inside a <span> tag and use inline CSS to specify the color. In general this should look something like this:
<span style = 'color:color name or hex code'>Text you want to color</span>Pay attention to the slash in the second </span> tag. If you miss that it won’t render properly because that’s invalid HTML.
Notice also that inside of scale_color_manual() I set guide = "none". This results in no legend being drawn which would be redundant in this plot.
Quite a neat solution, isn’t it?
While you need to revert to HTML for coloring the text you can use markdown for making individual words bold (e.g. **Roche**), italics (e.g. *overtook*) and so forth. I love the flexibility this offers.
The {ggtext} package is available from CRAN. You can install it running this code.
install.packages("ggtext")Setting individual theme elements to ggtext::element_markdown() can add quite a bit of boilerplate code to your plot. That’s why I decided to create the {mdthemes} package which provides themes that interpret text as markdown out of the box. Let’s contrast a “normal” theme with an md_theme. First, have a look at what happens if I add theme_minimal() to the plot I just created.
plot + theme_minimal()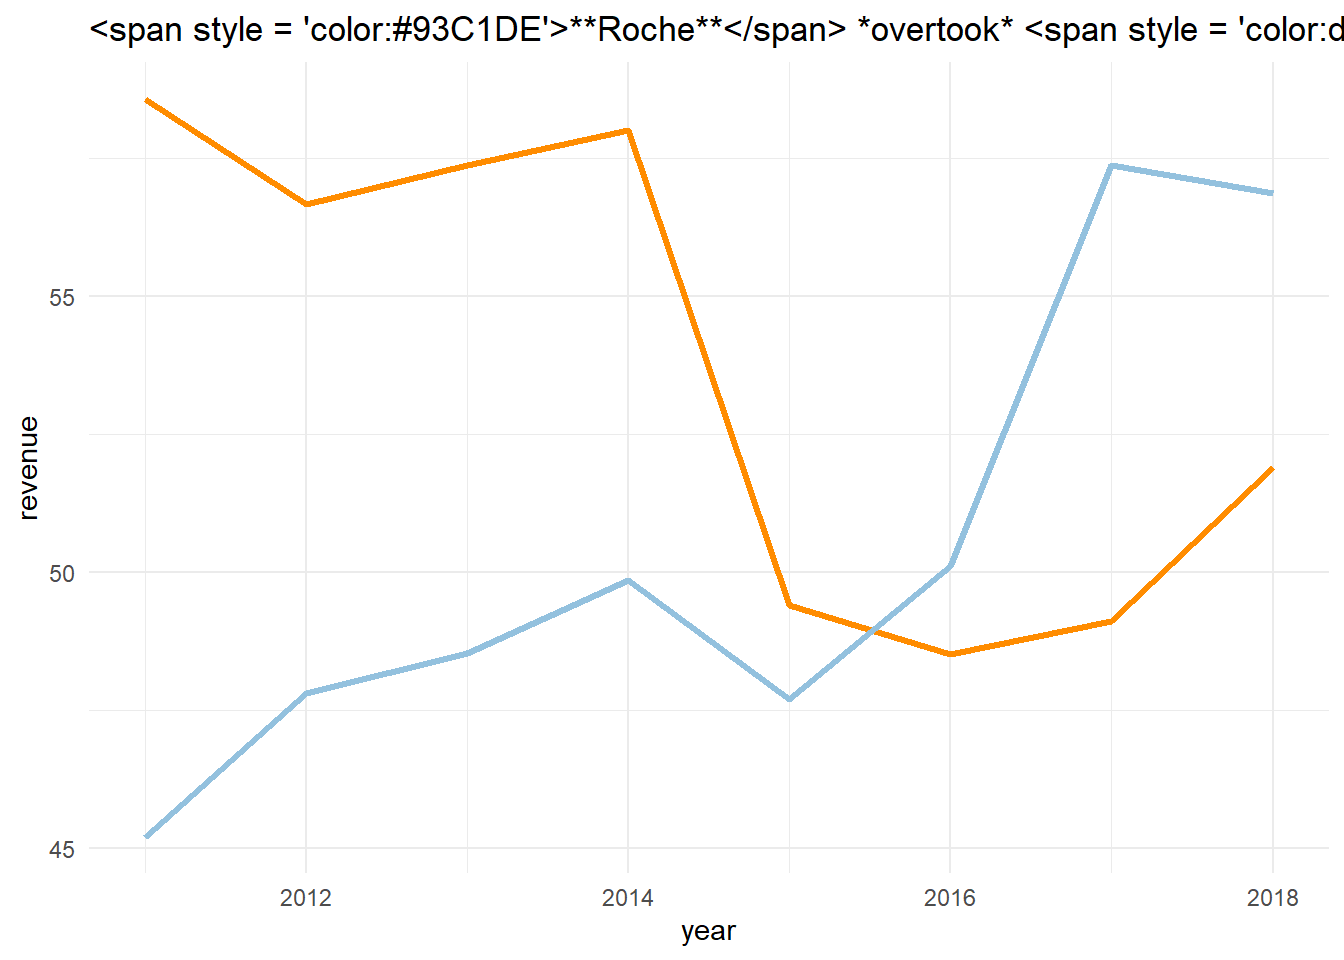
As expected, the title is not rendered correctly because the plot.title theme element is overwritten. If you use md_theme_minimal(), however, it just works.
plot + mdthemes::md_theme_minimal()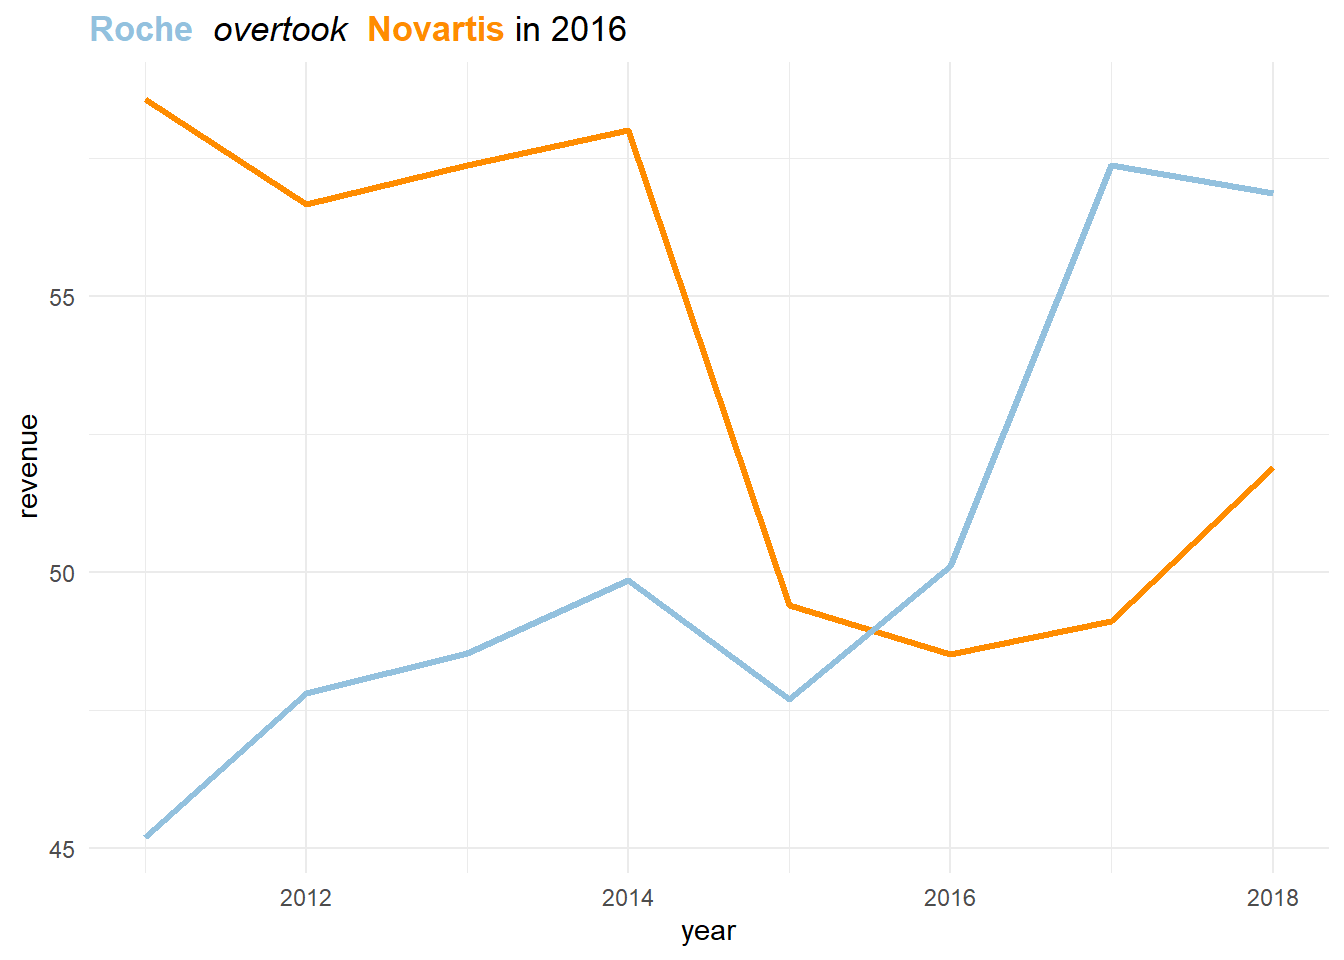
Apart from the title, the subtitle, axis labels and captions are set to element_markdown() for all mdthemes.
plot +
  labs(
    x = "**Year**",
    y = "Revenue (*Billion* USD)",
    caption = "Data Source: *en.wikipedia.org/wiki/List_of_largest_biomedical_companies_by_revenue*"
  ) +
  mdthemes::md_theme_minimal()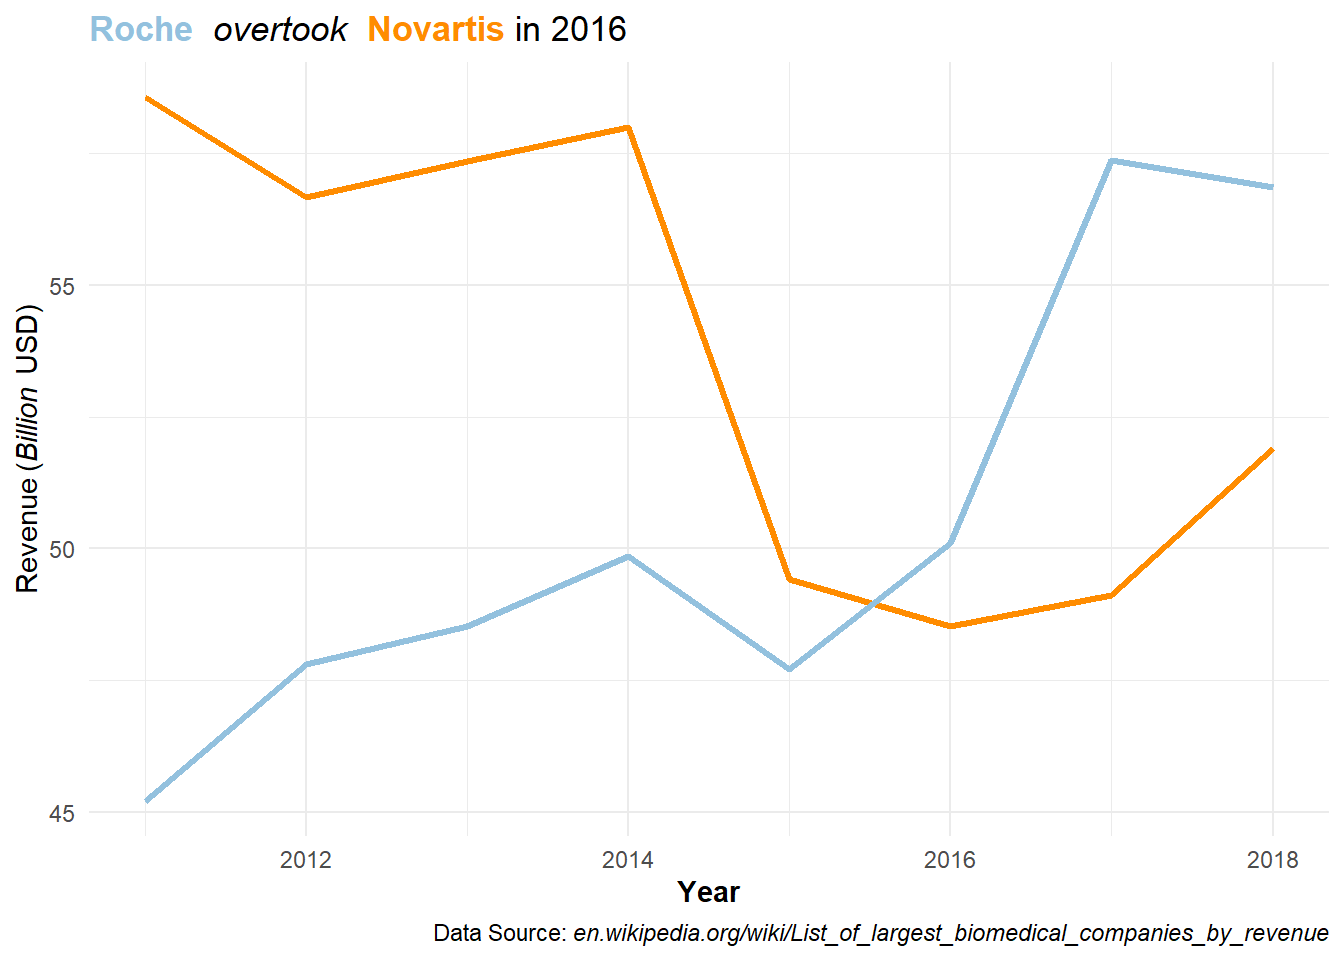
The {mdthemes} packages currently contains all themes from {ggplot2}, {ggthemes}, {hrbrthemes}, {tvthemes} and {cowplot} with support for rendering text as markdown.
If you want to turn a theme that is not part of the {mdthemes} package into an md_theme you can use the as_md_theme() function.
plot + mdthemes::as_md_theme(theme_minimal())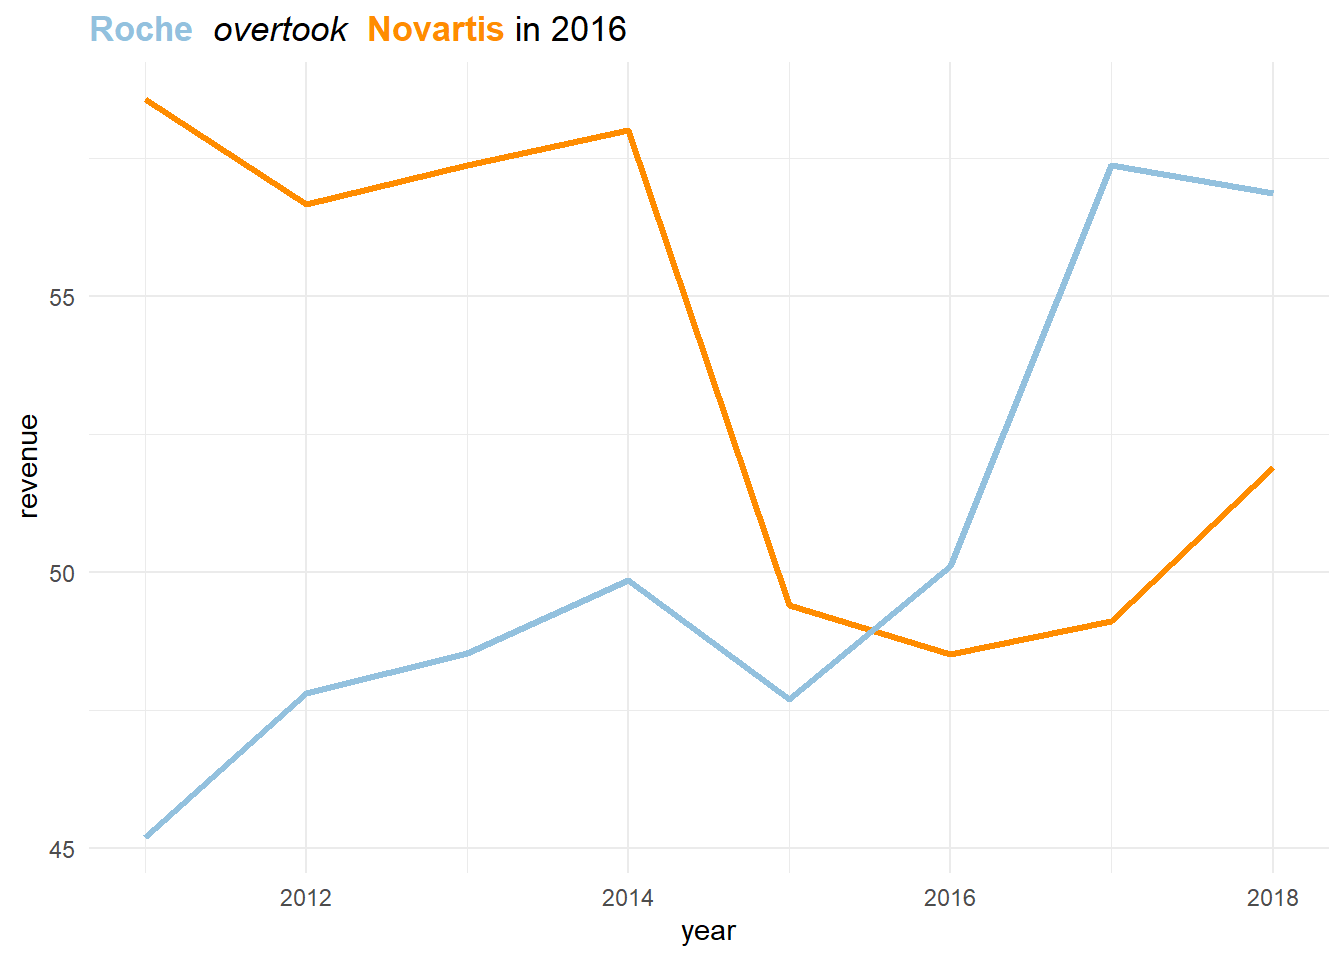
Just like {ggtext}, the {mdthemes} package is available from CRAN. You can install it by copy-pasting this code into your R console.
install.packages("mdthemes")