How to Add a Regression Line to a ggplot?
This article is also available in Spanish and Italian.
Linear regression is arguably the most widely used statistical model out there. It’s simple and gives easily interpretable results. Since linear regression essentially fits a line to a set of points it can also be readily visualized. This post focuses on how to do that in R using the {ggplot2} package.
Let’s start off by creating a scatter plot of weight (wt) vs. horse power (hp) of cars in the infamous mtcars dataset.
library(ggplot2)
data(mtcars)
p <- ggplot(mtcars, aes(wt, hp)) +
  geom_point()
p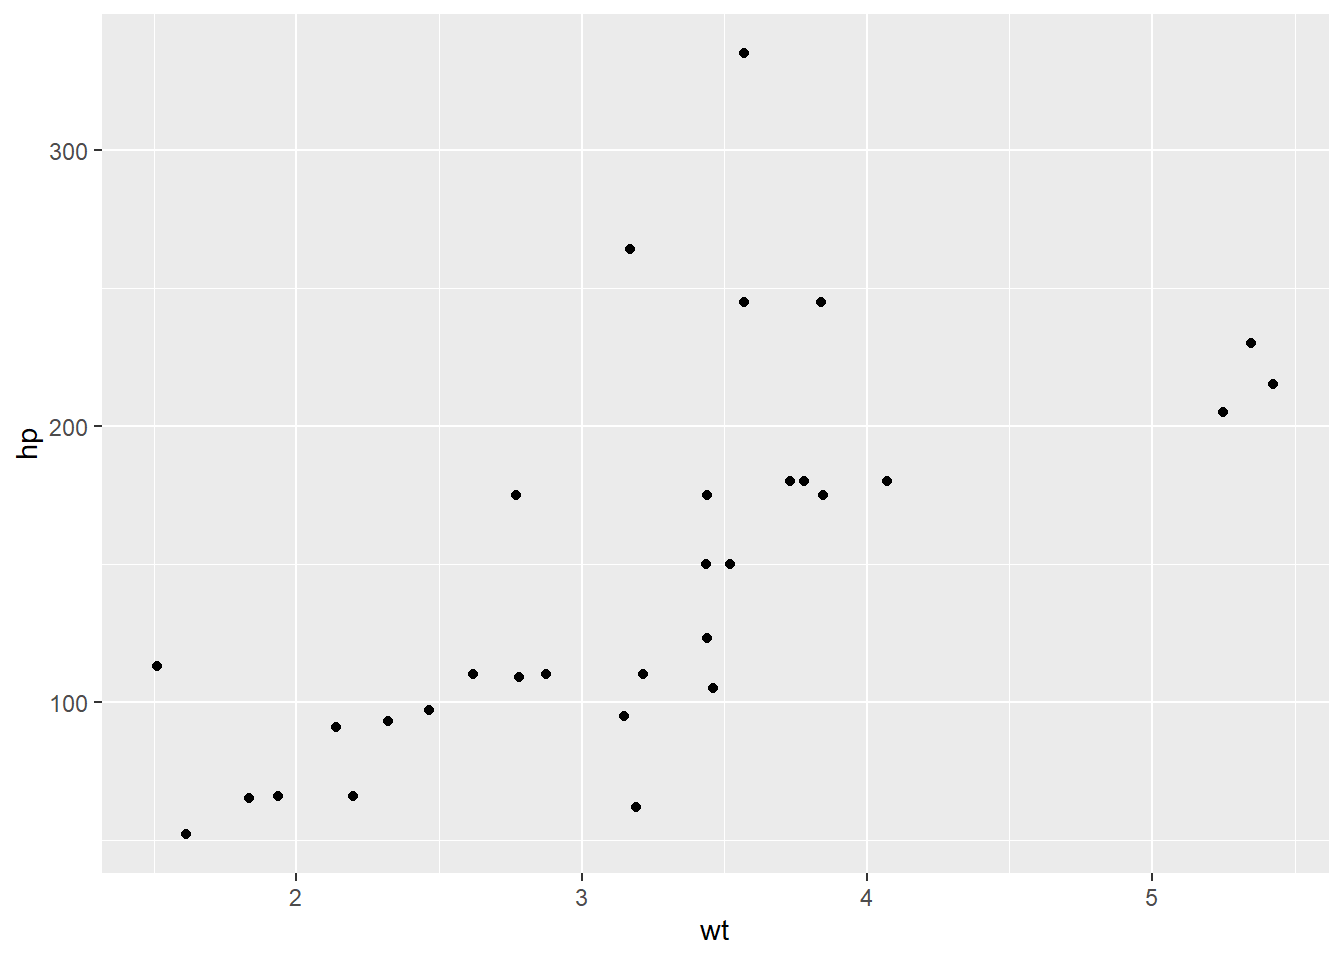
There’s an obvious positive trend visible: the heavier a car is the higher its horse power tend to be.
Next, let’s add a smoother to make this trend even more apparent.
p + geom_smooth()
By default, geom_smooth() adds a LOESS smoother to the data. That’s not what we’re after, though. To make geom_smooth() draw a linear regression line we have to set the method parameter to "lm" which is short for “linear model”.
p + geom_smooth(method = "lm")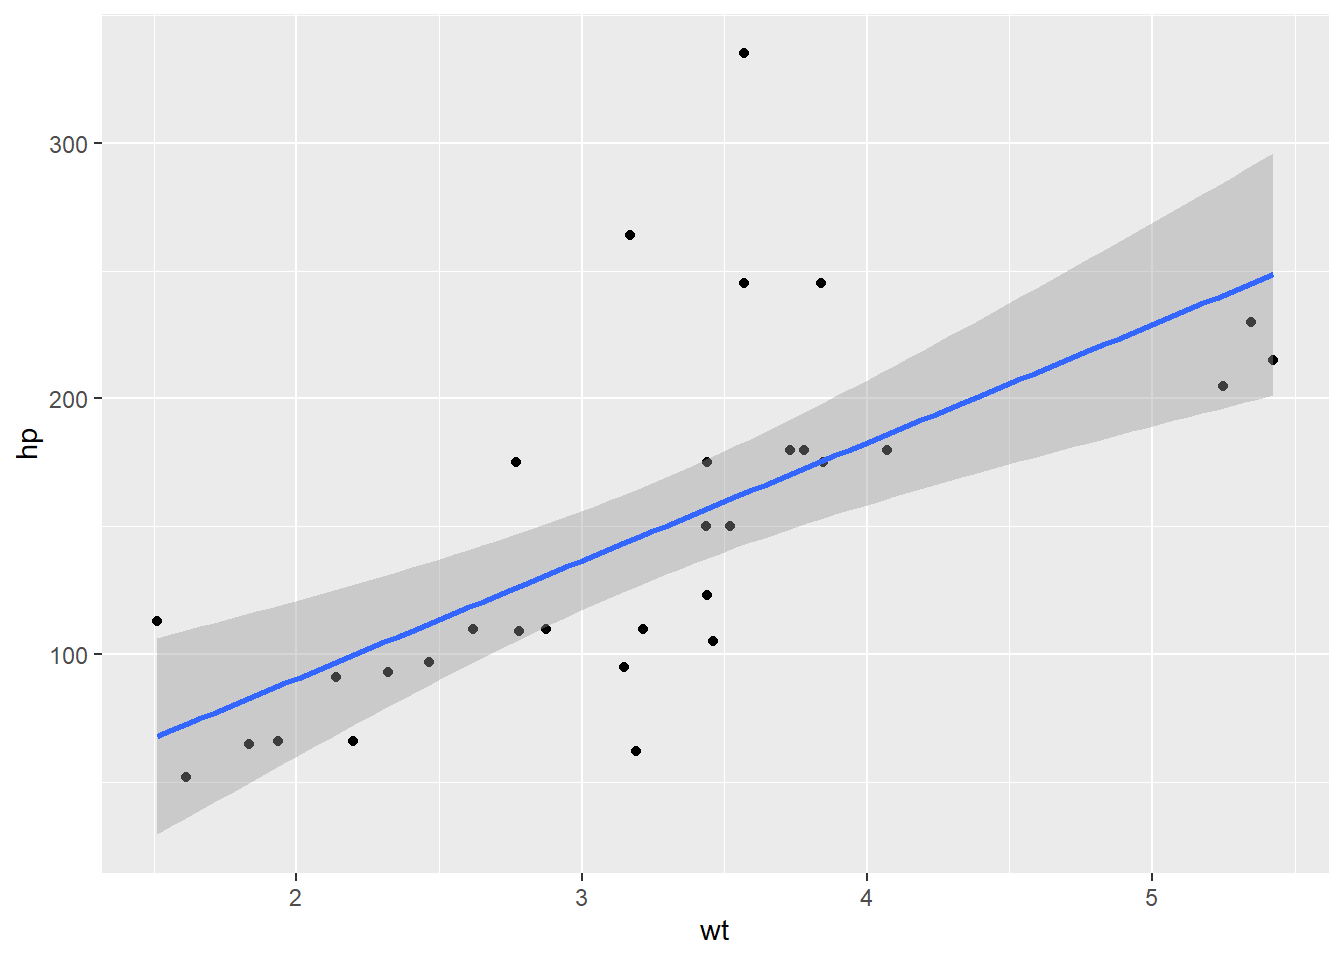
The gray shading around the line represents the 95% confidence interval. You can change the confidence interval level by changing the level parameter. A value of 0.8 represents a 80% confidence interval.
p + geom_smooth(method = "lm", level = 0.8)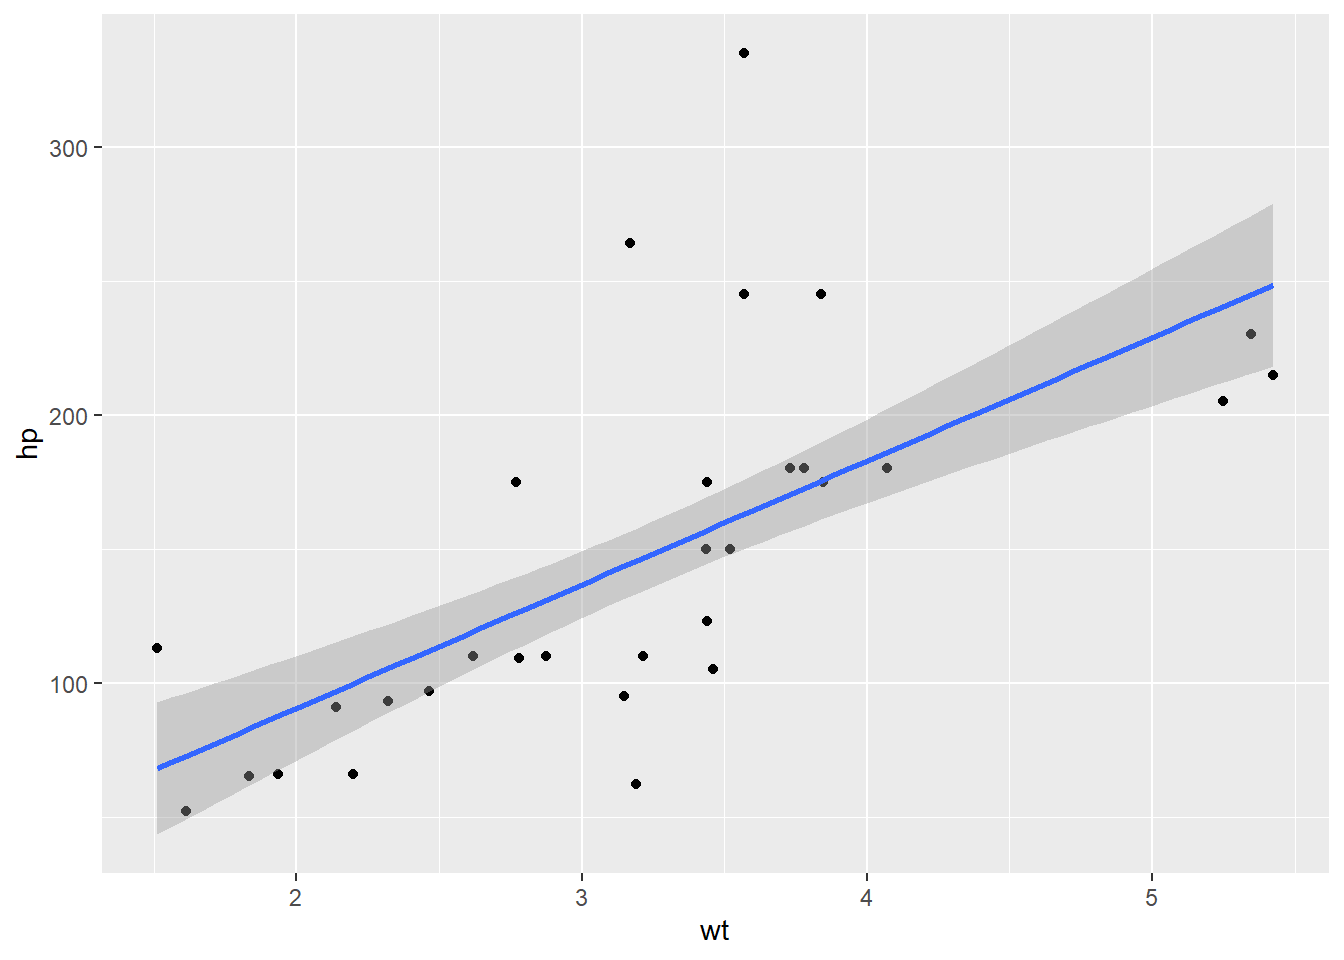
If you don’t want to show the confidence interval band at all, set the se parameter to FALSE.
p + geom_smooth(method = "lm", se = FALSE)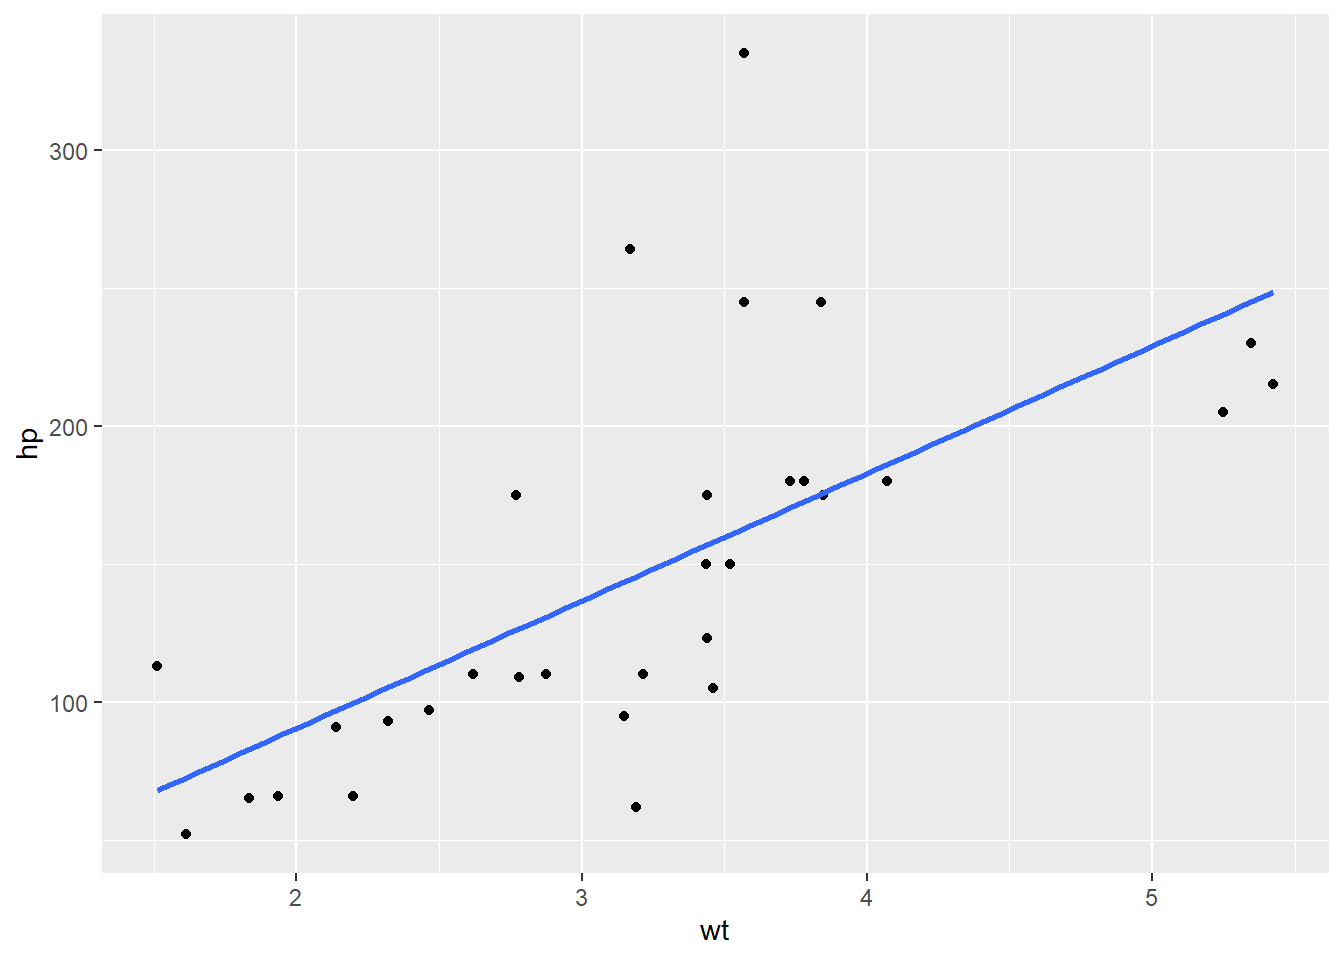
Sometimes a line is not a good fit to the data but a polynomial would be. So, how to add a polynomial regression line to a plot? To do so, we will still have to use geom_smooth() with method = "lm" but in addition specify the formula parameter. By default, formula is set to y ~ x (read: y as a function of x). To draw a polynomial of degree n you have to change the formula to y ~ poly(x, n). Here’s an example fitting a 2nd degree (quadratic) polynomial regression line.
ggplot(mtcars, aes(qsec, hp)) +
  geom_point() +
  geom_smooth(method = "lm", formula = y ~ poly(x, 2))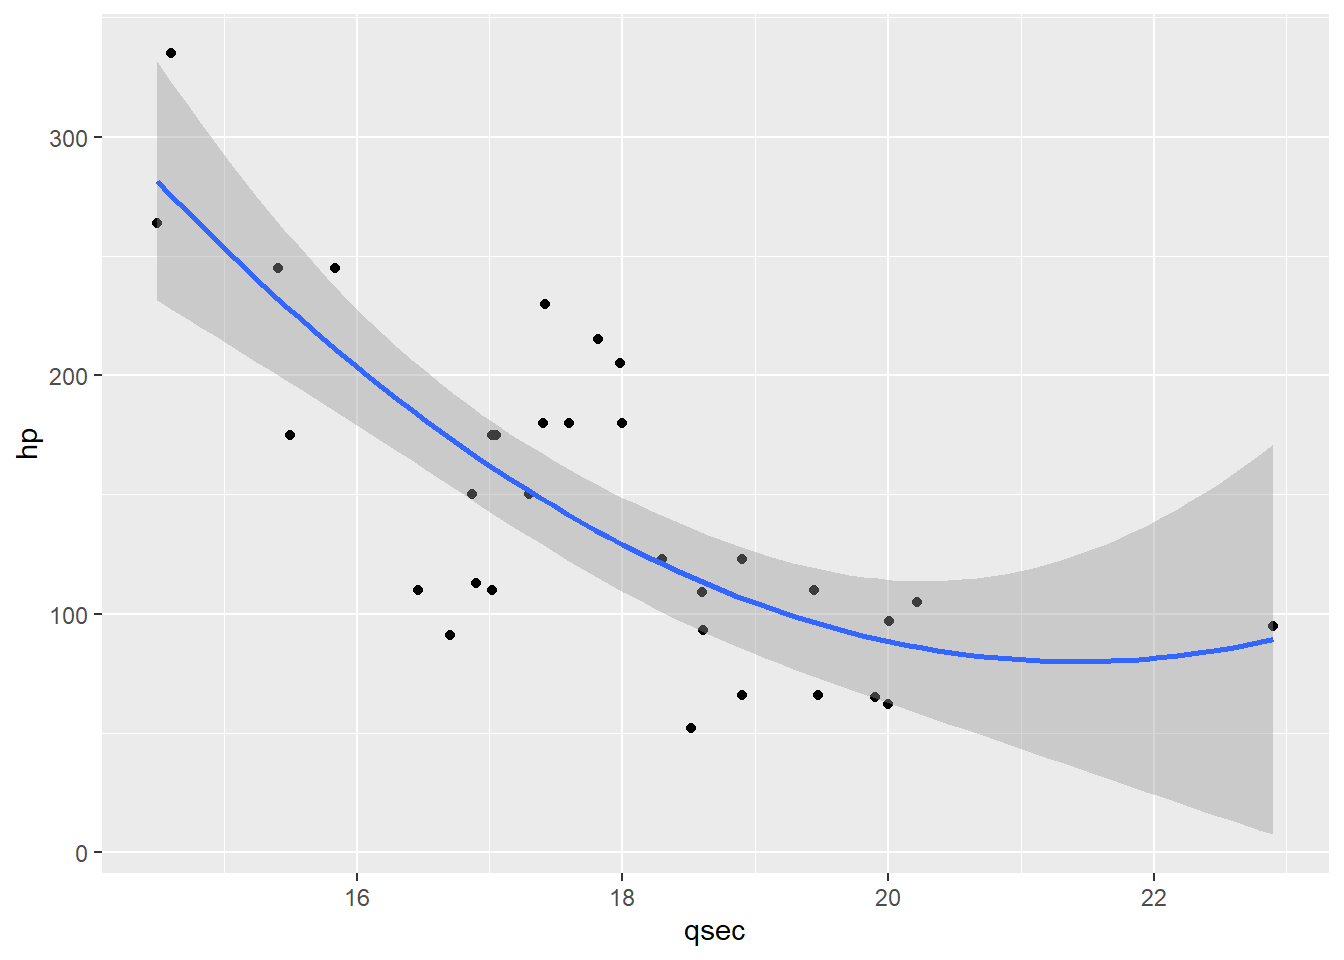
Now it’s your turn! Start a new R session, load some data, and create a ggplot with a linear regression line. Happy programming!