Adjusting only the upper or lower axis limit using ggplot2
If you want to change only the lower or upper bound of your plot axis pass NA for the value you don’t want to set inside either xlim() or ylim().
library(ggplot2)
library(patchwork)
theme_set(ggcharts::theme_hermit(grid = "XY"))
data(mtcars)
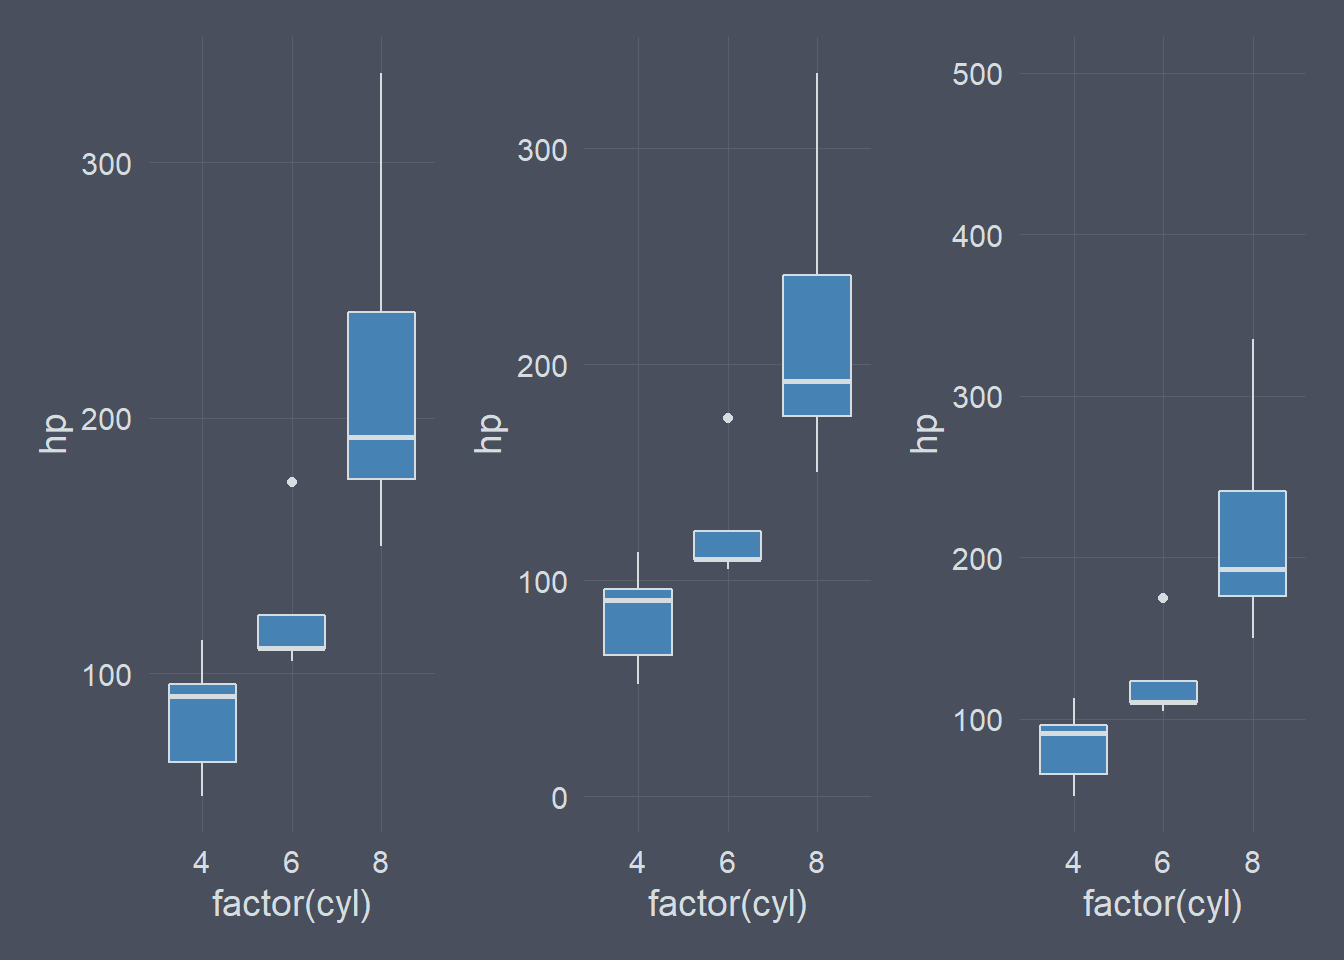
p1 <- ggplot(mtcars, aes(factor(cyl), hp)) +
geom_boxplot(color = "#D6DDE1", fill = "steelblue")
p2 <- p1 + ylim(0, NA)
p3 <- p1 + ylim(NA, 500)
p1 | p2 | p3